TABLE OF CONTENTS
- What is carbon capture and storage (CCS)?
- What is the current status of CCS?
- How to simulate the CCS technology growth in En-ROADS?
- Why does CCS not grow more?
- What is the impact of CCS on emissions and the climate?
This article explains how to simulate the deployment of carbon capture and storage (CCS) technology in En-ROADS, as well as the impact of CCS on CO₂ emissions and the climate. Watch the video below for a summary.
What is carbon capture and storage (CCS)?
Carbon capture and storage (CCS) is an emerging technology designed to prevent CO₂ emissions from coal, natural gas, and bioenergy combustion from entering the atmosphere. The process involves three steps: capturing CO₂ at large power plants and industrial facilities, transporting it via pipelines, and storing it in underground geological formations. Currently, the industry has yet to deploy CCS technologies at scale. To do so they must overcome challenges such as high costs and infrastructure limitations. Even if widely implemented, CCS is only viable for some power plants and large industries, such as steel and cement production.
En-ROADS includes sliders and graphs to simulate the growth of fossil CCS, bioenergy CCS (BECCS), and direct air carbon capture and storage (DACCS). CCS captures emissions at the source before it enters the air, while DACCS is a related technology that pulls CO₂ directly from the air, making it a form of carbon dioxide removal (CDR). See the different CDR methods included in En-ROADS in this CDR infographic, and refer to the glossary for definitions of these similar but distinct terms.
What is the current status of CCS?
To see the current status of CCS in En-ROADS, use the Baseline Scenario and look at the graphs:
- “Primary Energy with CCS by Source” (under Graphs > Primary Energy Demand—Totals).
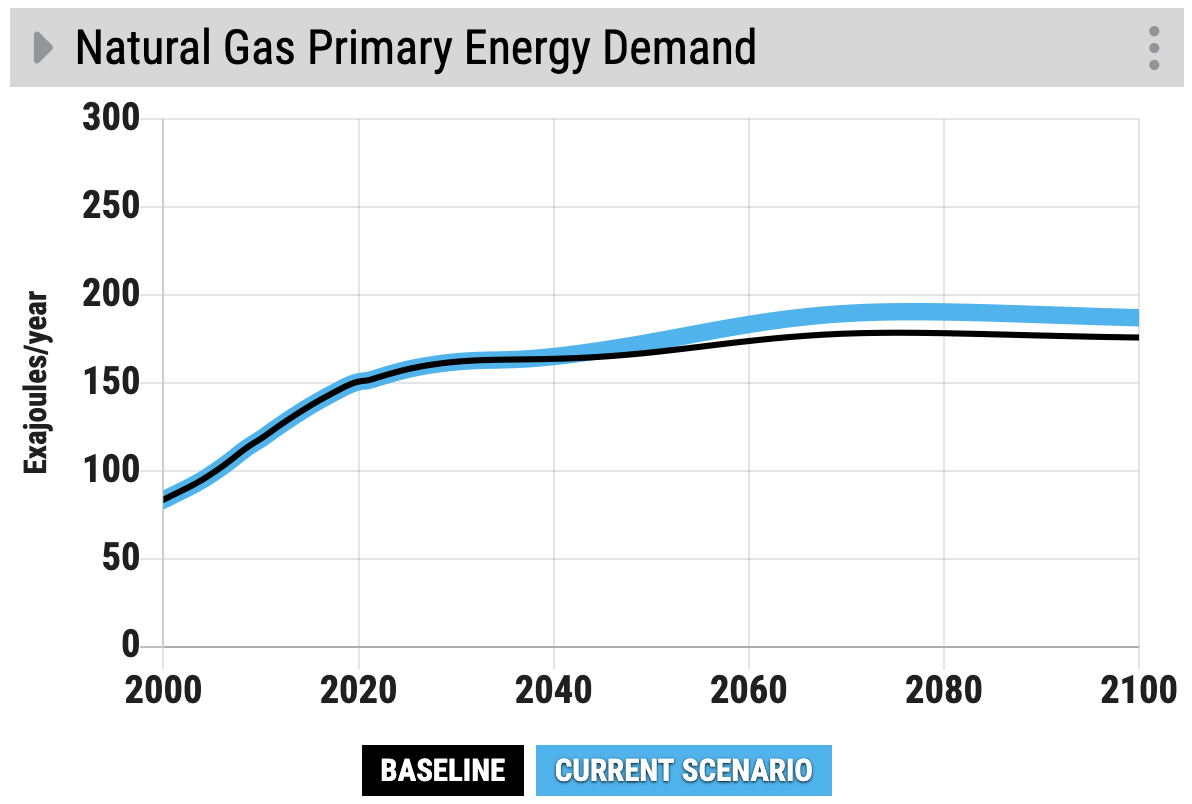
- “Natural Gas Primary Energy Demand” (under Graphs > Primary Energy Demand—Types).
Currently, the CCS technology is almost non-existent. In 2024, less than 1 exajoule of natural gas electricity generation used CCS (left). For context, look at the scale of the global natural gas industry in the Natural Gas Primary Energy Demand graph (right).

Note: The following sections will focus on natural gas CCS, but you can explore similar graphs and dynamics for coal and bioenergy CCS. To learn more about BECCS and DACCS, read the Bioenergy in En-ROADS Explainer, and the DACCS in En-ROADS Explainer.
How to simulate the CCS technology growth in En-ROADS?
There are three primary ways to incentivize CCS in En-ROADS:
1. Subsidize individual types of CCS
The “Carbon capture and storage (CCS) subsidy” sliders in the advanced views for Coal, Natural Gas, and Bioenergy, provide subsidies for CCS infrastructure in dollars per ton of CO₂ captured. For example, a subsidy of $85/ton CO₂ for natural gas CCS simulates the implementation of the tax credit found under Section 45Q of the U.S. Internal Revenue Code at the global scale.
By itself, the subsidy to gas CCS leads to significant growth in deployment over multiple decades, particularly from 2035-2050 (look at the growth of the blue line in the left graph), a notable rate for large-scale industrial equipment. Even with steady growth, CCS covers only a limited share of global natural gas demand (see the grey areas in the “Natural Gas Primary Energy Demand by Use and CCS” graph to the right, under Graphs > Primary Energy Demand—Types).

2. Apply a carbon price
A carbon price increases the cost of energy sources according to how much CO₂ they emit. Because CCS technology removes much of the CO₂ from fuel combustion before it is released, a carbon price incentivizes its use by making unabated fossil fuels and bioenergy less competitive. For example, see this scenario with a $100/ton CO₂ carbon price added on top of the natural gas CCS subsidy of $85/ton CO₂, which drives CCS to cover about 10% of direct fuel demand and 35% of electric power demand by 2050.
3. Add a clean electricity standard
In the advanced view of the Carbon Price slider, users can test a clean electricity standard that counts CCS as a qualifying source of clean power. However, due to the high cost of CCS, this policy alone may not significantly boost its adoption without additional subsidies or carbon price.
This scenario combines the three policies that deploy CCS.
Why does CCS not grow more?
In the scenario above, CCS is actually growing quite fast but the abated fraction of the natural gas emissions is still small. One of the main reasons is that use of CCS starts very small and takes time to scale at the global level. There are two other reasons for slower or more limited growth than some might expect.
1. CCS can only be applied to a limited share of gas capacity.
Technological constraints, site limitations, and high installation costs restrict CCS to a fraction of power plants and large industrial facilities, excluding smaller or distributed CO₂ sources like residential buildings or transportation.
The pie chart below gives an example of the maximum possible amount of natural gas energy demand that could be fitted with CCS. The plotted area shows that in 2023 in the En-ROADS Baseline Scenario, a maximum of 58% of primary energy demand from natural gas had the potential to be fitted with CCS. The remaining 42% of natural gas primary energy demand comprised buildings, transport, and a fraction of industry and electricity generation that would not be suitable for CCS.

2. CCS technology is expensive and unlikely to benefit significantly from economies of scale
Coal and gas CCS cost more than $100/ton CO₂ in 2024, as shown in the “Cost of Fossil CCS” graph (under Graphs > Financial). Cost reductions due to learning and economies of scale are limited. The default “Progress ratio” is 0.95 (adjustable under Simulation > Assumptions > Carbon capture and removals > Carbon dioxide capture and transport), which means that every doubling of capacity reduces costs by only 5%. This improvement is slower than that seen in other, more standardized technologies like solar PV modules (Molhotra and Schmidt, 2020)1 because CCS systems are complex and need to be highly customized for each facility they are used on.

What is the impact of CCS on emissions and the climate?
For the analysis, consider the effect of a scenario with a stronger subsidy to natural gas CCS of $150/ton CO₂, and look at the “CO₂ Emitted from Gas and Captured by CCS” graph below (under Graphs > CO₂ Emissions). In the Baseline, without a CCS subsidy, emissions would follow the black line, but with a CCS subsidy, the actual emissions are reduced (grey area) because a fraction is captured by CCS (light blue).

This high CCS subsidy has a minimal effect on reducing CO₂ emissions because it also encourages overall natural gas demand (see the boost in the “Natural Gas Primary Energy Demand” graph below). This happens because deploying CCS requires parallel investment in general natural gas infrastructure (e.g. pipelines and gas extraction), which helps keep overall gas costs lower, further encouraging its use. Use the “Marginal Cost of Electricity Production” graph (under Graphs > Financial) to see the cost reduction in natural gas.
Additionally, CCS does not reduce all of the CO₂ emissions from an industrial or electricity generation facility. Estimates of the capture effectiveness of CCS range from below 50% of emissions captured to over 90%. The default capture effectiveness in En-ROADS of 80% can be adjusted under Simulation > Assumptions > Carbon capture and removals > Carbon dioxide capture and transport.
The high CCS subsidy in this scenario leads to only a slight temperature reduction by 2100, compared to the Baseline. The change is so small that it is only visible when hovering over the Temperature to see an additional decimal place or using the “Temperature Change” graph. This limited impact is primarily due to two key factors:
- Lower unabated emissions from natural gas.
- Reduced coal use, as the natural gas industry replaces some coal-fired power (crowding out dynamic).
However, five counteracting effects limit these benefits:
- CCS does not scale enough to capture a significant share of emissions.
- CCS requires large amounts of energy to operate (see the “Energy Used to Capture and Store Carbon” graph), increasing overall energy demand and associated emissions.
- Greater natural gas use leads to slightly higher methane emissions from leaks.
- Subsidizing CCS (or any energy source) lowers energy prices, leading to increased overall energy consumption.
As a result, the overall temperature reduction remains negligible and the key takeaway from this is:
While the CCS subsidy helps capture some CO₂ from natural gas, its effect on lowering emissions and temperature is minimal. This is because the CCS technology, while growing fast, cannot grow fast enough to cover much of the enormous amount of emissions from natural gas.1.Malhotra, A., & Schmidt, T. (2020). Accelerating Low-Carbon Innovation. Joule, 4, (11), 2259-2267.↩